
A new Skills page in Insights
One page per skill shows how a rollout is going, from assessment scores to course progress, feedback, and behavior change, with filters that follow you into the detailed reports.
Insights now opens on a Skills page: one report per skill your organization runs, answering three questions in one place. Where did learners start, how is the learning going, and are they applying it? If you run LeaderFactor programs for your organization, you no longer have to piece that story together from separate reports.
What’s new
Insights in the navigation
A new Insights section in the left navigation holds Skills, Behavior Change, and Feedback. The assessment and toolkit reports now open from each skill’s page, so they no longer have their own navigation items.
Every skill at a glance
The Skills page shows a card for each skill on your organization’s plans. Each card shows the skill’s framework, its average assessment score (for example, PSindex® avg.), how many participants have taken the assessment, and a trend line. Select Open the report to see the full picture.
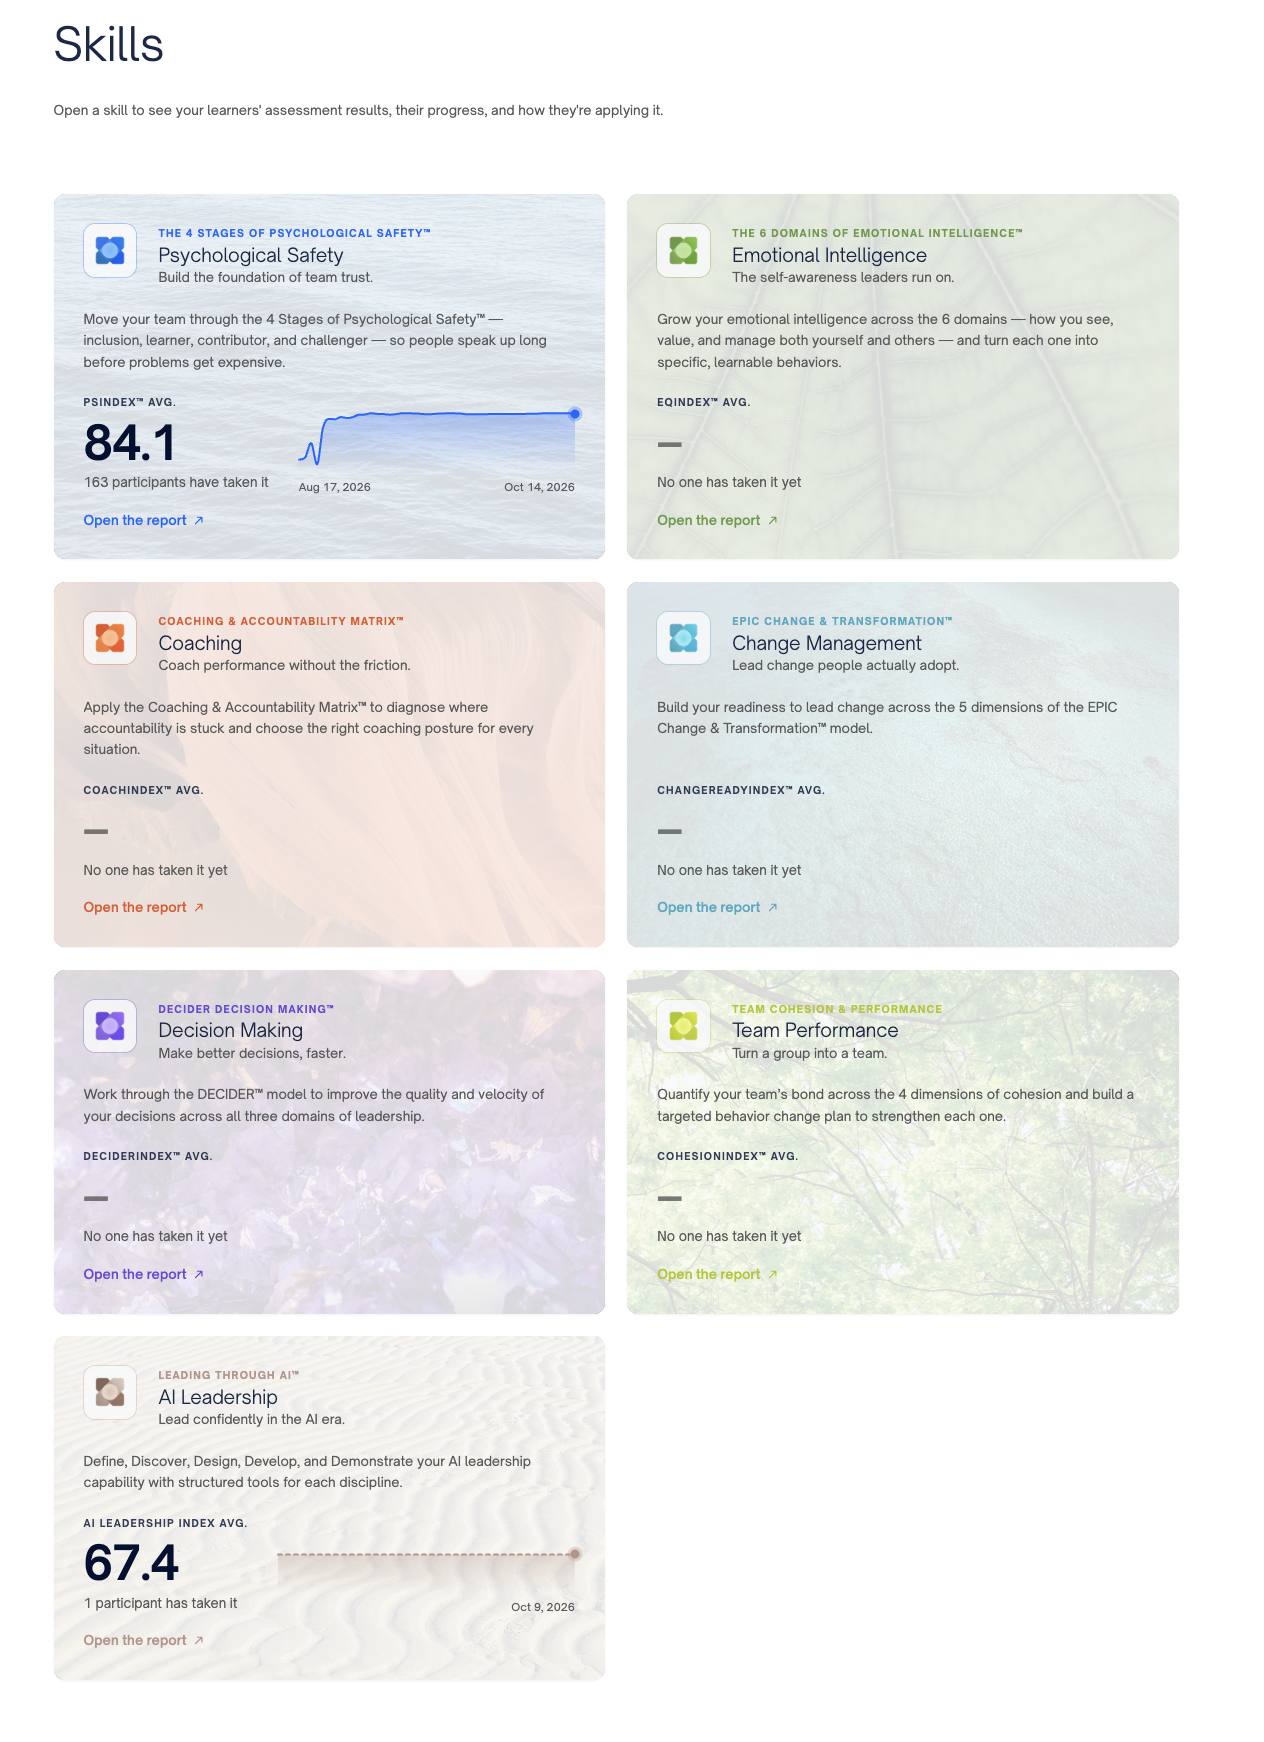
One report per skill
Each skill’s report opens with the average score on its assessment over time (for example, Average PSindex® score), counting each person’s latest self-assessment. Beside it, a rollout strip shows when your first cohort Started, how many workshop Cohorts you’ve run, how many Learners are enrolled, and the skill’s Toolkit.
Below that, How your rollout is going reads top to bottom in three bands:
- Assess: how many learners took the assessment, and how many asked for external feedback (raters answered, waiting on raters, or haven’t asked).
- Learn: average course progress, net promoter score with a tier (Excellent, Great, Good, or Needs work), overall course quality out of 10, and rotating quotes from learner feedback. A Workshop / On-demand toggle switches between the two. Overall quality is asked in workshops only, so it shows on the Workshop view.
- Apply: how many learners have an action plan, how many checked in last week, and how many are using the skill’s toolkit. Skills without a toolkit show the first two.
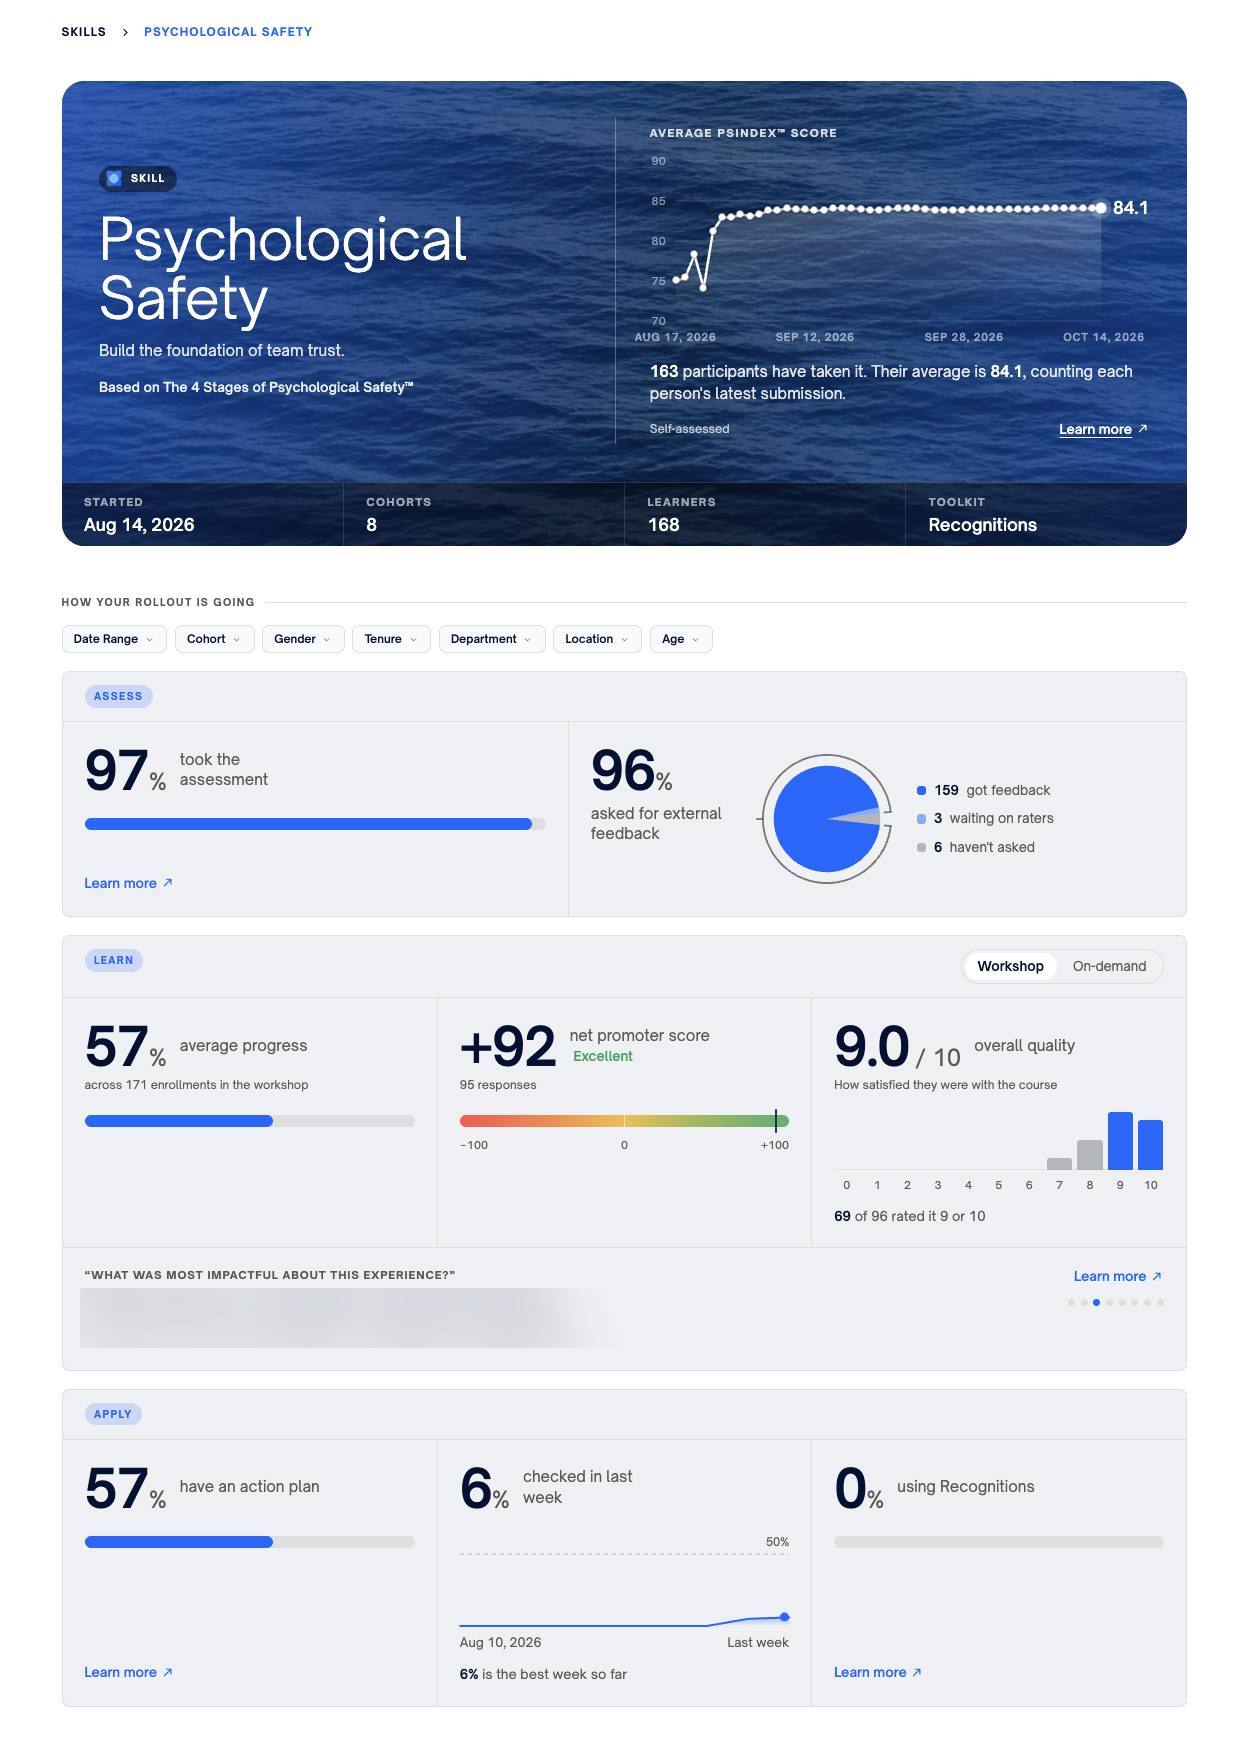
Filters that follow you
Narrow the whole report with Date Range, Cohort, and your organization’s demographic attributes. Select Learn more on a reading to open its detailed report. The assessment and toolkit reports keep all of your filters. The feedback report keeps the date range and cohort, and the behavior change report opens filtered to the skill.
Improvements
- Each reading shows a short note explaining when it will fill in, instead of an empty chart.
- Cohort filters include every workshop cohort for the skill, however small.
Get started
- In the left navigation, under Insights, select Skills.
- Select Open the report on a skill card.
- Use Date Range, Cohort, or a demographic filter to focus on one group.
- Select Learn more on any reading to open the detailed report with your filters applied.
Insights is available to admins in organizations with the Insights plan. Organizations that had assessment, toolkit, or behavior change reporting have it automatically. Questions? Reach out to the LeaderFactor solutions team at [email protected].