
A redesigned PSindex® Team Survey experience
PSindex® Team Survey has a new interface from the survey list to the heatmap, with team report panels, bookmarks, and an org chart view, and no changes to your data, scores, or benchmarks.
PSindex® Team Survey has a new interface, rebuilt from the survey list to the deepest team report. If you run psychological safety surveys for your organization, everything is easier to read and faster to act on. This release changes nothing about your data: same questions, same scoring, same benchmarks, and every survey you have already run gets the new experience automatically.
Looking for the individual development experience instead? See Updated results screens for PSindex® Self-assessment.
What’s new
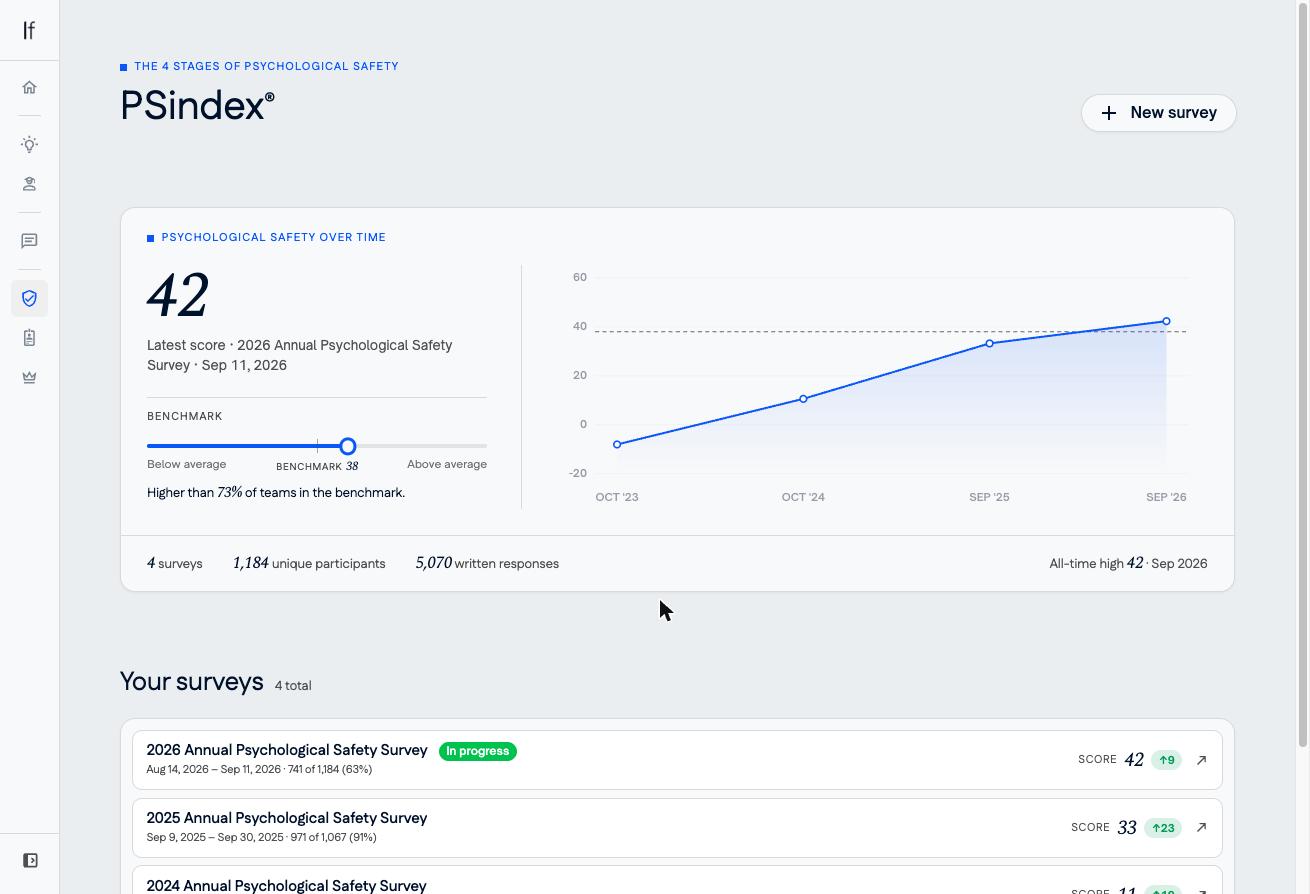
Psychological safety over time
The PSindex® home now opens with your organization’s trajectory: your latest score, where it sits against the benchmark, and a trend line across every survey you have run. Each survey in the list shows its score and the change from the survey before it, so progress is visible at a glance.
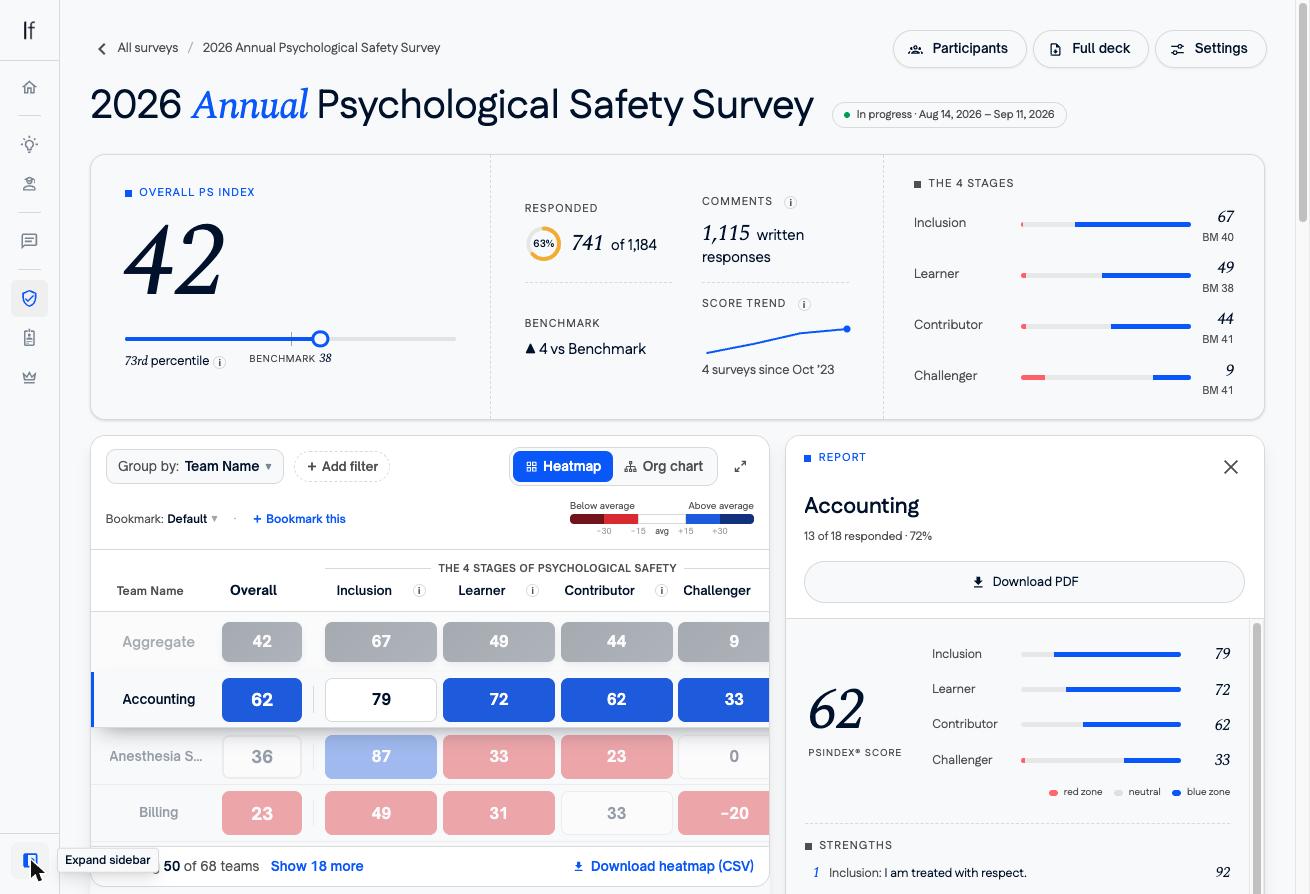
A redesigned results page
Open a survey and the essentials sit at the top: your overall score with its benchmark and percentile, response and comment counts, the score trend, and a bar for each of the four stages of The 4 Stages of Psychological Safety™.
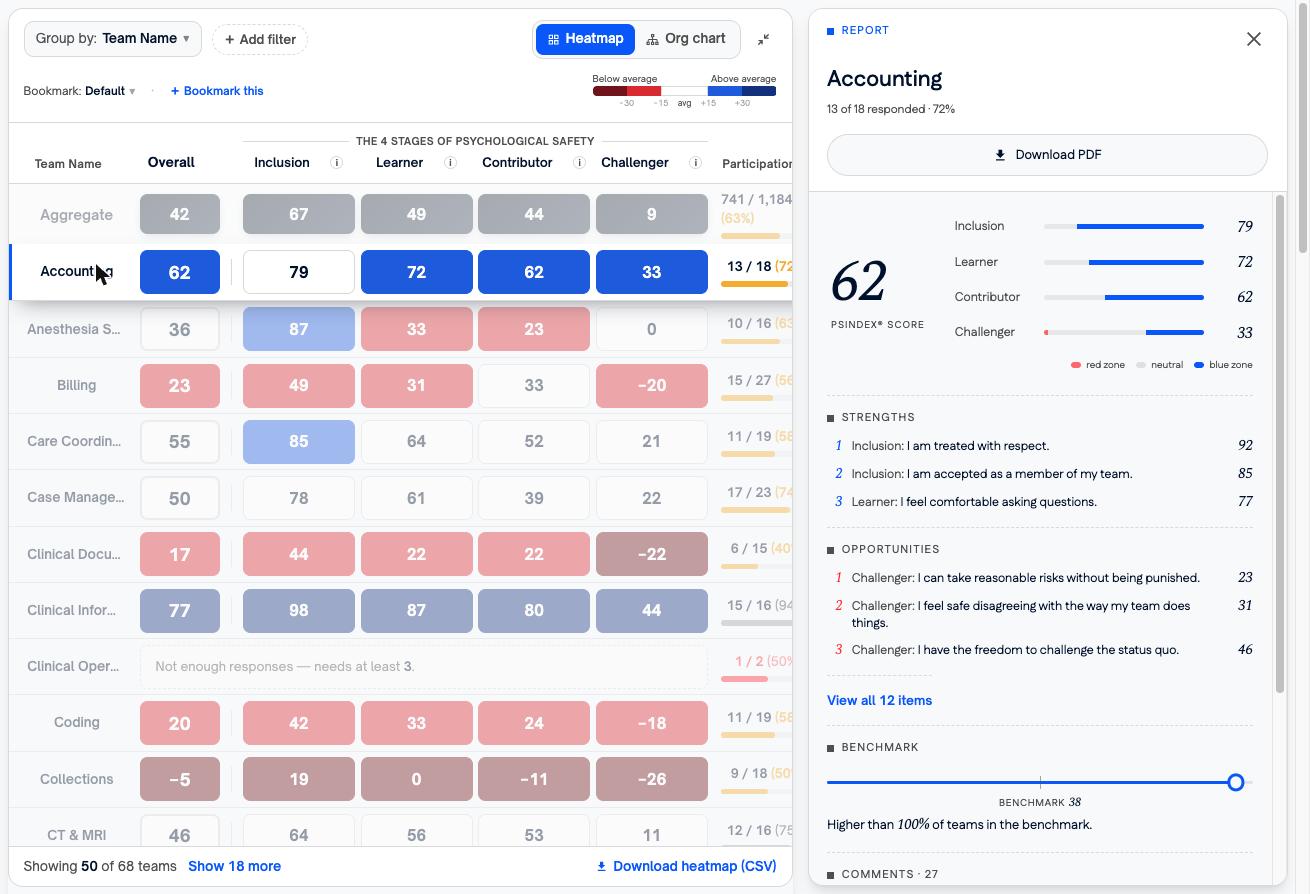
A more flexible heatmap
Group results by any attribute you uploaded: Team Name, Department, Location, Manager Email, Shift, or Tenure. Layer on filters, switch on the manager hierarchy, expand to full screen, or export with Download heatmap (CSV). When you find a slice you will want again, save it with Bookmark this and jump back to it anytime.
Team reports in a side panel
Click any heatmap row to open that team’s report next to the heatmap: the team’s score and stage breakdown, its top strengths and opportunities, all 12 survey items, its benchmark position, and its comments. Download PDF gives you a shareable version in one click.
Comments, grouped by prompt
Written responses now live inside each team’s report, organized under the four open-ended survey prompts, with a Download comments (CSV) export. Anonymity protections carry over: teams under the response threshold never generate a report.
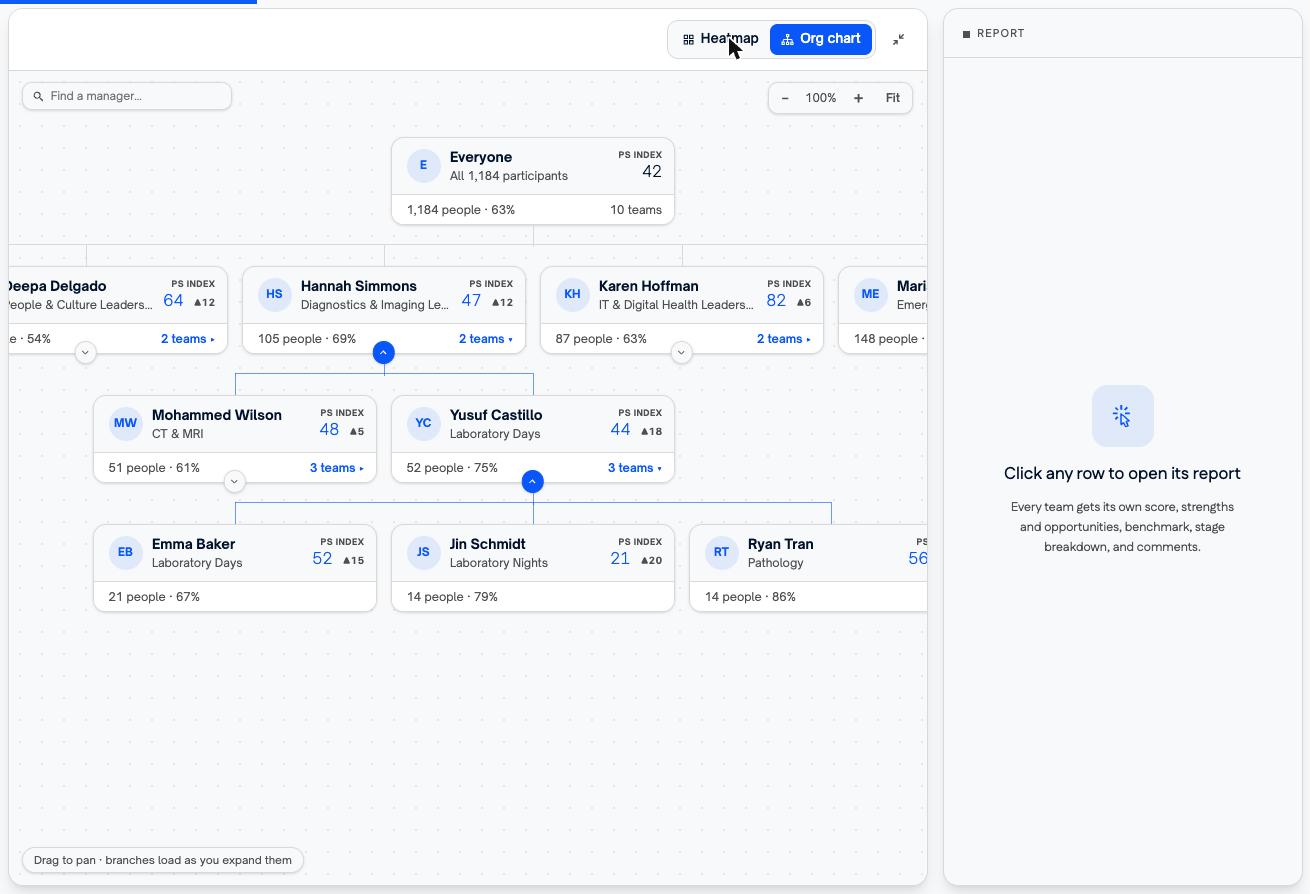
Org chart view
Switch the results view from Heatmap to Org chart to see psychological safety across your reporting lines. Pan, zoom, search for a manager, and expand branches as you go. Every manager node shows that downline’s score, headcount, and response rate, and clicking a node opens the same report panel scoped to that manager’s downline.
The classic report
The report you used before the redesign is still available. At the bottom of a team’s report panel, Classic report opens that team’s results in the classic full-screen view, which is useful for debriefing a team or walking a group through results on a shared screen.
Improvements
- In-progress surveys open to a management page with a live funnel: participants, invitations sent, started, and responses received.
- The participants table filters by any attribute you uploaded and exports to CSV.
- Survey settings are consolidated on one page: dates and reminder cadence, the default report grouping, a previous survey to compare against, and the response threshold.
- Clearer messaging when a team has too few responses to report.
Get started
- In the sidebar under Manage, open PSindex®.
- Open a survey. An in-progress survey shows its funnel first; click View Results. Closed surveys open straight to results.
- Use Group by and Add filter to slice the heatmap, then Bookmark this to save the view.
- Click any team row to open its report, and Download PDF to share it.